Creating Diagrams with MermaidJS and ChatGPT: Automating the Visualization of Processes and Workflows
Language
date
Jan 29, 2023
thumbnail
slug
creating_diagrams_with_mermaidjs_and_chatgpt_automating_the_visualization_of_processes_and_workflows
author
status
Public
tags
Blog
Open Source
summary
Create diagrams easily with MermaidJS and ChatGPT. Automate visualization of processes and workflows, saving time and effort for developers and project managers.
type
Post
updatedAt
Aug 21, 2023 05:57 PM
Status
In progress
Person
Introduction to MermaidJSUnderstanding the Syntax of MermaidJSCreating Flowcharts with MermaidJS.Using MermaidJS with ChatGPT.Conclusion
Introduction to MermaidJS
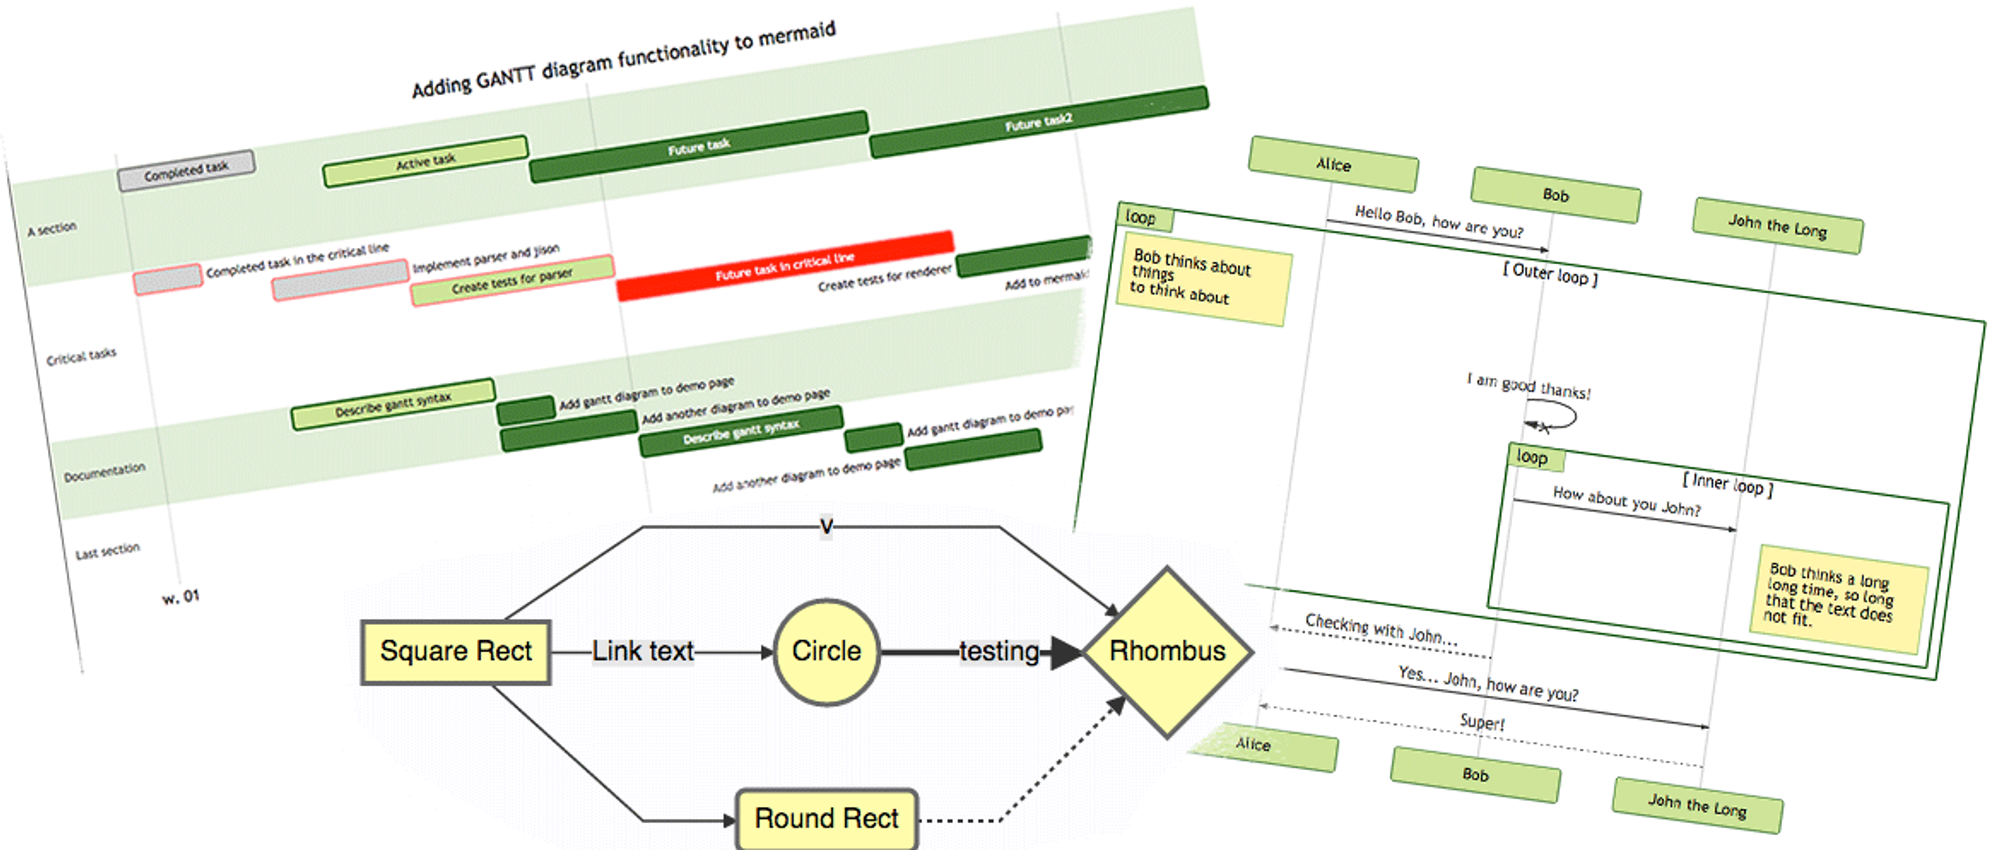
MermaidJS is a JavaScript library that allows developers and non-developers to create diagrams and flowcharts in a simple and intuitive way. The library uses a markdown-like syntax to define the diagrams, making it easy to create and customize visual representations of processes and workflows.
MermaidJS supports a wide range of diagram types, including flowcharts, Gantt charts, state diagrams, and more. The library also allows for customization of the diagrams through the use of different shapes, colors, and styles, making it a powerful tool for visualizing complex systems and processes.
One of the unique features of MermaidJS is its ability to integrate with a variety of platforms, including web applications, chatbots, and even text-based programming languages like ChatGPT. This allows developers to create diagrams and flowcharts directly within their code, making it easy to visualize and understand the logic of their applications.
Overall, MermaidJS is a versatile and user-friendly library that can help developers and non-developers alike to create visual representations of processes and workflows in a simple and intuitive way. With its wide range of diagram types and customization options, MermaidJS can be a valuable tool for understanding and communicating complex systems and processes.
Understanding the Syntax of MermaidJS
The syntax of MermaidJS is designed to be simple and intuitive, making it easy for developers and non-developers to create diagrams and flowcharts. The library uses a markdown-like syntax to define the diagrams, which consists of a series of nodes and arrows that represent the different elements of the diagram.
Nodes in MermaidJS are represented by text enclosed in parentheses, and can be connected by arrows to represent the flow of the process. For example, in a flowchart, a node representing a login page could be connected to a node representing a check credentials step.
graph TD;
    Login(Login Page)-->CheckCredentials(Check Credentials);
In this example, the "Login" and "CheckCredentials" nodes are connected by an arrow, indicating that the login page leads to the check credentials step.
Arrows in MermaidJS are represented by lines that connect the nodes, and can include labels to indicate the flow of the process. In the example above, the arrow is unlabeled, but it could also include a label like "Submit" to indicate that the user is submitting their credentials.
graph TD;
    Login(Login Page)-->CheckCredentials(Check Credentials);
    Login-->CheckCredentials[Submit];
In addition to nodes and arrows, MermaidJS also allows for the creation of subgraphs, which can be used to group related elements of the diagram together. Subgraphs are defined by enclosing the elements in curly braces and are useful for organizing large diagrams.
graph TD;
    subgraph Login Flow
        Login(Login Page)-->CheckCredentials(Check Credentials);
    end
    subgraph Access Flow
        CheckCredentials-->AccessGranted(Access Granted);
        CheckCredentials-->AccessDenied(Access Denied);
    end
In this example, the diagram is divided into two subgraphs, "Login Flow" and "Access Flow", which group the related elements of the diagram together.
In summary, the syntax of MermaidJS is simple and intuitive, making it easy for developers and non-developers to create diagrams and flowcharts. The library uses a markdown-like syntax that consists of nodes, arrows, and subgraphs to define the different elements of the diagram and represent the flow of the process.
Creating Flowcharts with MermaidJS.
Creating Flowcharts with MermaidJS
Flowcharts are a popular and useful way to visualize processes and workflows, and MermaidJS makes it easy to create them. The library uses a simple and intuitive syntax to define the different elements of the flowchart, including nodes and arrows.
To create a basic flowchart, you will need to define the different nodes in the process, and connect them with arrows to represent the flow of the process. For example, the following code creates a flowchart of a basic login process:
graph TD;
    Login(Login Page)-->CheckCredentials(Check Credentials);
    CheckCredentials-->AccessGranted(Access Granted);
    CheckCredentials-->AccessDenied(Access Denied);
graph TD;
    Login(Login Page)-->CheckCredentials(Check Credentials);
    CheckCredentials-->AccessGranted(Access Granted);
    CheckCredentials-->AccessDenied(Access Denied);
In this example, the flowchart starts with a "Login Page" node, which leads to a "Check Credentials" node. The "Check Credentials" node is then connected to two other nodes, "Access Granted" and "Access Denied", which represent the possible outcomes of the login process.
To add labels to the arrows, you can use square brackets after the arrow, like this:
graph TD;
    Login(Login Page)-->CheckCredentials(Check Credentials);
    CheckCredentials-->AccessGranted(Access Granted);
    CheckCredentials-->AccessDenied(Access Denied);
    Login-->CheckCredentials[Submit];
graph TD;
    Login(Login Page)-->CheckCredentials(Check Credentials);
    CheckCredentials-->AccessGranted(Access Granted);
    CheckCredentials-->AccessDenied(Access Denied);
    Login-->CheckCredentials[Submit];
In this example, the arrow connecting the "Login Page" to the "Check Credentials" node is labeled "Submit".
In addition to the basic syntax, MermaidJS also allows for the customization of flowcharts through the use of different shapes, colors, and styles. You can change the shapes of the nodes, colors of the arrows and backgrounds, and even add images.
graph TD;
    style Login fill:#f9f,stroke:#333,stroke-width:4px;
    style CheckCredentials fill:#f9f,stroke:#333,stroke-width:4px;
    style AccessGranted fill:#f9f,stroke:#333,stroke-width:4px;
    style AccessDenied fill:#f9f,stroke:#333,stroke-width:4px;
    Login(Login Page)-->CheckCredentials(Check Credentials);
    CheckCredentials-->AccessGranted(Access Granted);
    CheckCredentials-->AccessDenied(Access Denied);
    Login-->CheckCredentials[Submit];
graph TD;
    Login(Login Page)-->CheckCredentials(Check Credentials);
    CheckCredentials-->AccessGranted(Access Granted);
    CheckCredentials-->AccessDenied(Access Denied);
    Login-->CheckCredentials[Submit];
In this example, each node has its own style, with a different fill color and stroke width.
In conclusion, MermaidJS makes it easy to create flowcharts, and it allows for customization of the diagrams through the use of different shapes, colors, and styles. With its simple and intuitive syntax, it is a powerful tool for visualizing processes and workflows.
Using MermaidJS with ChatGPT.
ChatGPT is a powerful language model that can be used to generate natural language text based on a given prompt. It can also be used to generate code and other structured text, such as diagrams.
One way to use ChatGPT with MermaidJS is to train the model on a dataset of diagrams written in MermaidJS syntax. This will allow the model to generate diagrams based on the input it receives.
To use ChatGPT with MermaidJS, you will need to first train the model on a dataset of diagrams written in MermaidJS syntax. Once the model is trained, you can prompt it to generate a diagram by providing it with a description of the diagram you want to create.
For example, you can prompt the model with the following:
Generate a flowchart of a basic login process.The model will then generate a diagram in MermaidJS syntax, similar to the example provided earlier in this article:
graph TD;
    Login(Login Page)-->CheckCredentials(Check Credentials);
    CheckCredentials-->AccessGranted(Access Granted);
    CheckCredentials-->AccessDenied(Access Denied);
    Login-->CheckCredentials[Submit];
graph TD;
    Login(Login Page)-->CheckCredentials(Check Credentials);
    CheckCredentials-->AccessGranted(Access Granted);
    CheckCredentials-->AccessDenied(Access Denied);
    Login-->CheckCredentials[Submit];
Another way to use ChatGPT with MermaidJS is to use the model to generate the text descriptions of the diagrams, and then use the MermaidJS library to render the diagrams based on the descriptions.
In conclusion, ChatGPT can be used in conjunction with MermaidJS to generate diagrams based on natural language descriptions. This can be a powerful tool for automating the creation of diagrams, and can save time and effort for users who are not familiar with the MermaidJS syntax.
Conclusion
In conclusion, MermaidJS is a powerful and easy-to-use library for creating diagrams, particularly flowcharts, that makes it simple to visualize processes and workflows. The library uses a simple and intuitive syntax to define the different elements of the flowchart, including nodes and arrows. This can be a useful tool for developers, project managers, and other professionals who need to visualize processes and workflows. Additionally, MermaidJS can be used in conjunction with ChatGPT to generate diagrams based on natural language descriptions, which can save time and effort for those who are not familiar with the MermaidJS syntax. Overall, MermaidJS is a valuable tool for anyone looking to create clear and effective diagrams to convey information in a simple and easy-to-understand way.